MONACA, Pa. — A comparison of administrative costs across the Big Ten shows proportional growth in faculty and staff ranks at Penn State, as well as an “outstanding ratio of students to administrators and staff.” The results, while not the only data being evaluated, point to an efficient use of resources at Penn State, which leaders say will continue to be monitored.
As follow up to a presentation given by Provost Nick Jones in March to the Board of Trustees on the topic of growth of administrative positions, Jones and David Gray, senior vice president for finance and business, outlined in more detail a comparison of student, faculty and staff growth across the Big Ten. Concerns have been raised nationally about possible over investments in administrative or ancillary areas that do not impact an institution’s mission of teaching or research. Jones and Gray indicated that this concern is a reasonable one to raise and staying on top of the issue through regular evaluation and monitoring will ensure that such investments are at an appropriate level.
“It merits ongoing careful consideration and study to ensure Penn State is not jeopardizing our core academic mission and investments, through inefficient deployment of administrative resources — or anything for that matter — throughout the University,” Jones told the board on Thursday (July 16).
Key Points
Jones recapped some of the key points from his March presentation, including:
-- During the past 10 years, the number of full-time Penn State employees has grown by about 2,400 people (55 percent in academic units; 23 percent in academic support units; and 22 percent in administrative support units)
-- The ratio of non-faculty to faculty remained the same from 2004 to 2013.
-- Increases in faculty and non-faculty are proportional over the decade and student enrollment is increasing.
-- Growth in administrative and professional staff numbers has been in several key areas: information technology; mental and physical health counseling; police and public safety; fundraising; risk management; and legal and regulatory compliance.
-- The current number of faculty and non-academic positions amounts to fewer people on a per-student basis now, serving a much larger student body.
-- Over the past 25 years, Penn State shaved off and reallocated $305 million from the operating budget.
Before delving into the comparative data, Jones warned that the “numbers by themselves don’t reveal the full picture,” saying that Penn State’s unique structure as “one university geographically distributed” sometimes skews the outcomes when compared against other schools.
In the comparison with 12 other schools in the Big Ten, Penn State’s student enrollment of 87,824 in 2013 exceeds by nearly 30,000 the next-highest enrollment in the Big Ten, (Ohio State), which has 57,466 students. Penn State served its nearly 90,000 students with 4,855 faculty and 11,375 non-faculty. Gray pointed out that Penn State’s ratio of non-faculty employees to faculty from 2004 to 2013 remained the same at 2.3 to 1.
“Ultimately, Penn State’s increase in non-faculty employees was found to be largely proportional to its increase in faculty during the same time frame, while student enrollment was increasing,” Gray said.
Sharing the chart below comparing the ratio of students per non-faculty, Gray noted that Penn State is ranked second best for its student to non-faculty ratio.
“It’s good to see Penn State near the top of the list compared to most other Big Ten institutions,” Gray said. “We are second only to Indiana and 40 percent better than the Big Ten average of 10:1 ratio of students to non-faculty.
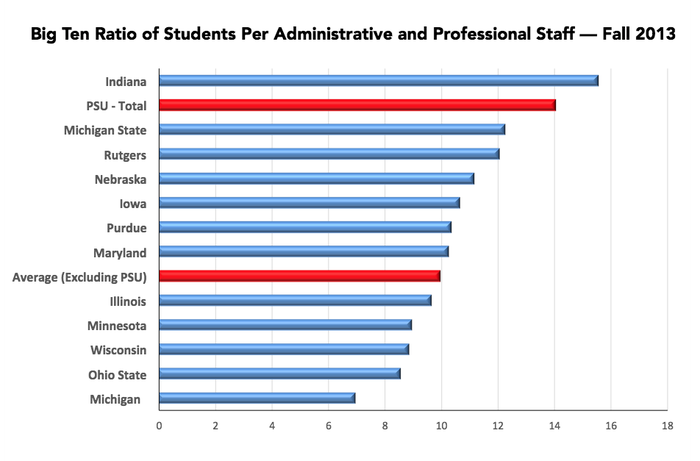
Penn State is ranked second best for its student to non-faculty ratio.
Given Penn State President Eric Barron’s determination to keep tuition increases modest and his plans for making a Penn State education more accessible and affordable, this data comparison indicates an overall institutional commitment to ensuring student success and keeping costs in check, according to Gray.